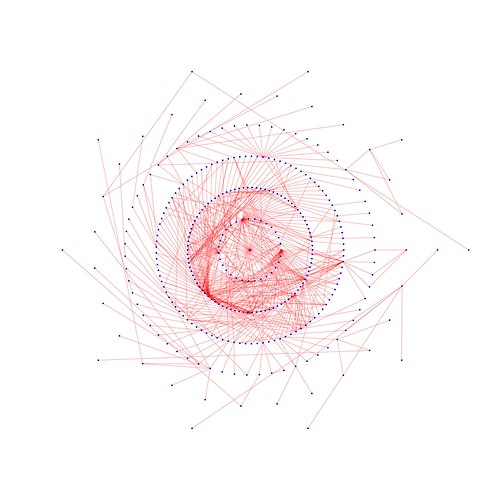
Take a complex database schema, apply a bit of python to produce an SVG graph and you can come up with weird and wonderful pictures:
If anybody is interested in the python code I used to create that graph, please ask. The more complicated and convoluted the database, the better the picture.

1 comment:
:-)
Like it.
Post a Comment