I've been using iMeasure roughly since I moved into the new house and here's what the graphs look like so far:
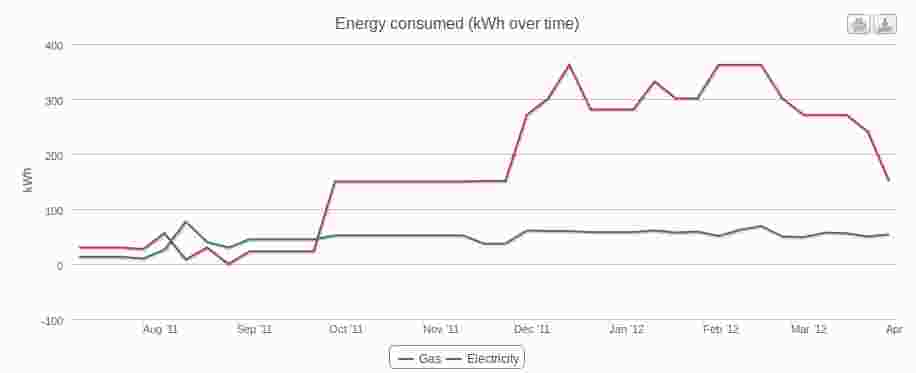
iMeasure Energy Usage Graph
There are two immediate observations on this graph:
- electricity use is not seasonnal,
- gas use definitely is!
The first observation tells me that my main electricity usage is probably not lighting as it doesn't change with the amount of daylight. So it's probably down to the big electrical items such as the washing machine and the fridge. I should be able to reduce that usage the day I replace them with new efficient models. One additional tidbit of trivia: the spike at the beginning of the graph is down to the sanding machines used when I had the wooden floors of the house sanded and varnished.
The second observation tells me that I need to work on insulating the house. In fact, I had thermal imaging done recently by the excellent Sustainable Lifestyles and it showed me very clearly that I have some low hanging fruit to pick first, in particular the loft insulation (or partial lack thereof) that results in very cold spots above the bay window in the master bedroom:

Cold Spot Above Bay Window
And at the junction points between walls and roof, the fact that whoever fitted the insulation in the loft didn't bother to fit it properly at the bottom causes cold spots underneath:

Cold Spots Where Wall Meets Roof
All this should be reasonably easy to fix so that will be my project for the summer and hopefully it should shave some of that spike off the graph for next year.